The primary objective of this dataset is to provide insights into the stock market performance of the select major companies. Through analysis, we aim to identify patterns, trends, and anomalies in the stock’s behaviour over time. By doing so, we hope to make informed decisions regarding the stock purchases, sales, or holdings, potentially.
KPI’s:
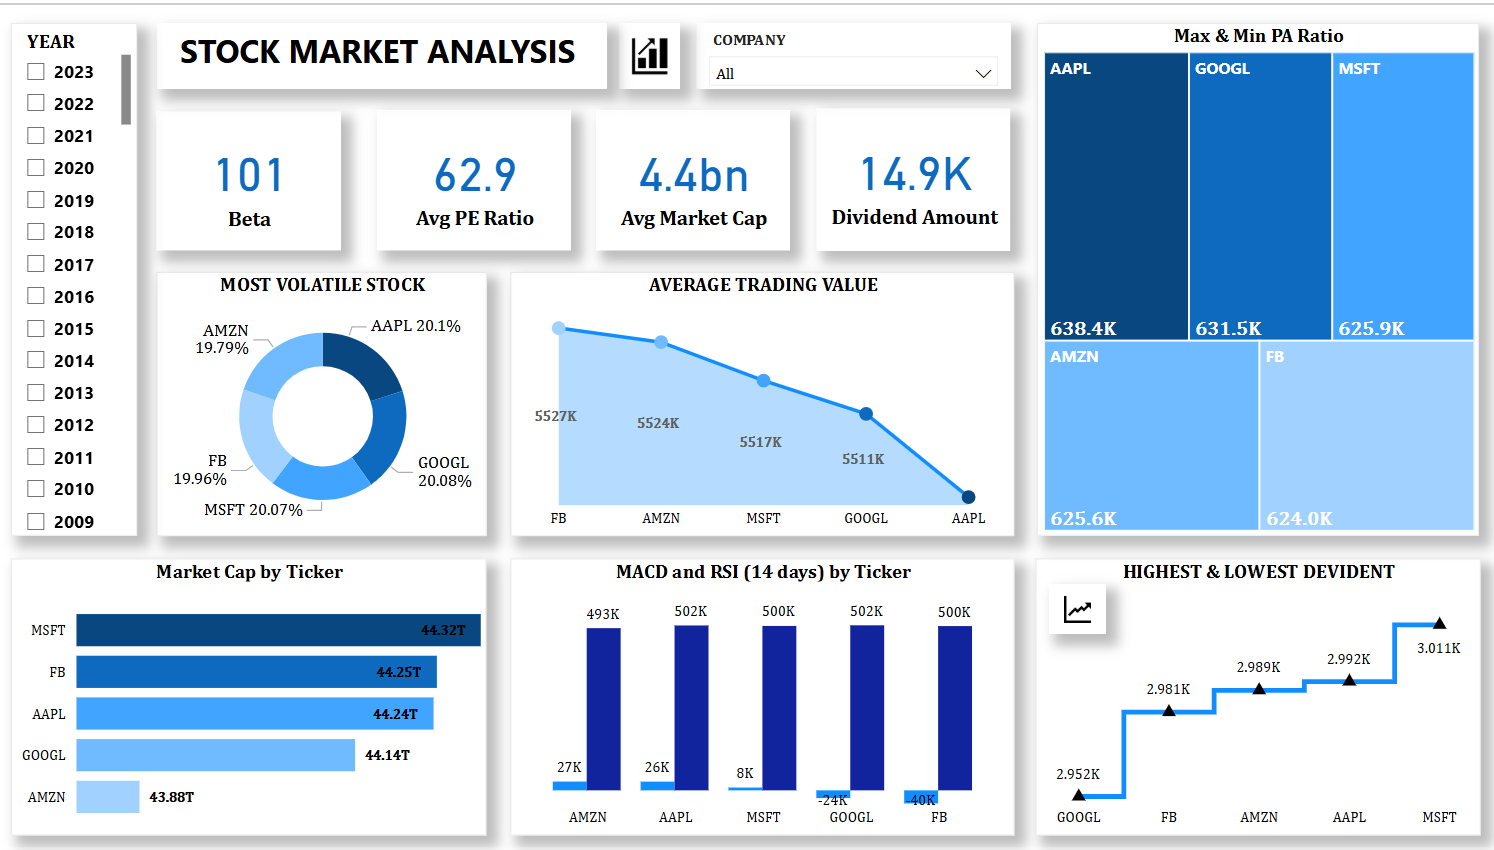
Average Daily Trading Volume: The average number of shares traded daily. High Trading volume indicates that a stock market is highly liquid. Liquidity refers to the ease with which assets can be bought or sold without significantly affecting their prices.
Most Volatile Stocks: Stocks with the highest Beta values. Stocks with the highest beta values typically indicate that they are more volatile and have higher price sensitivity to market movements compared to overall market Index.
Stocks with Highest Dividend and Lowest Dividend: Stocks that have provided the highest dividend amounts and lowest amounts. Stocks with low or no dividends are often associated with growth investing. Generally, companies reinvest their earnings to fund expansion, research and development, and other growth initiatives rather than distributing them to shareholders.
Highest and Lowest P/E Ratios: Identification of stocks with the highest and lowest Price-to-Earnings ratios.
a) High P/E ratios are often associated with stocks that investors expect to have strong earning growth in the future. These stocks are often considered growth stocks. Investors are willing to pay a premium for these companies because they believe that their earnings will increase significantly.
b) Low P/E ratios are often associated with value stocks. These stocks are perceived as undervalued by the market, and investors and they may conceive that the current stock price does not reflect the company’s true worth
Stocks with Highest Market Cap: Companies with the largest market capitalizations. Stocks with the highest market cap offer stability and liquidity, they may not offer the same growth opportunities as smaller, high growth stocks. Market Cap is a measure of a company’s total market value.
Stocks with Strong Buy Signals and stocks with Strong Selling Signal: Using the MACD and RSI, stocks that are potentially good buys (e.g., MACD above signal line and RSI below 30)
a) RSI below 30 indicates oversold market and a sign of potential buying opportunity because the stock or asset may be undervalued or oversold and there the probability is higher that price can bounce back. (Oversold market is one that has fallen sharply and expected to bounce higher) and RSI moves towards 80 it indicates overbought conditions. (Overbought market has risen sharply and is possibly ripe for a decline). Whenever RSI value is between 30 and 80 is often considered as a neutral zone, suggesting the stability in the price movements. Whenever RSI value is greater than 80 indicates overbought condition and a sign of potentially strong selling opportunity.
b) When the MACD value is greater than 0, it means that the stock’s short – term trend is bullish and this can be seen as a potential buying signal and when the MACD value is less than 0 indicates that stock short term trend is bearish and it can be seen as a Potential selling signal or shortening signal.