
01
Live capture
Inspect requests and responses through Chrome DevTools — headers, bodies, timing, cookies and query parameters.
TraceAna captures browser network traffic, then helps you find the failure, explain the evidence, compare requests, replay calls, and move toward a fix — without pretending Chrome can do things it cannot.
Healthy request. 142ms response time and a successful 200 status. No immediate diagnostic signal.
TraceAna is organized around the questions developers ask while debugging — not around a long list of buttons.
Tap a category to see only the capabilities that match the task you're doing right now.
Inspect requests and responses through Chrome DevTools — headers, bodies, timing, cookies and query parameters.
Use expressions such as status:500 method:POST time:>1000 instead of digging through dropdowns.
Break timing into DNS, connection, TLS, TTFB and download phases where the browser exposes them.
Save captures for later and work with standard HAR import/export.
Diagnose common 401/403/404/429/5xx and CORS problems with evidence, ranked causes and confidence.
Score performance from observed slow calls, duplicates, polling patterns and parallelization opportunities.
Find the first meaningful failure and distinguish evidence-backed cascades from timing correlation.
Compare a working and failing request across headers, cookies and body changes.
Re-fire captured requests or edit method, headers and body before sending.
Generate cURL, fetch, Python, PHP, Node, C# and Postman output with credentials masked by default.
Infer an OpenAPI 3.0 document from real traffic and label it clearly as inferred.
Block, redirect or modify supported headers, plus body-only response mocking.
Rule-based diagnosis and generated tests/docs run locally in the extension with no external AI call.
Optional local proxy for traffic outside the browser tab, including another app or a phone on the same Wi-Fi.
Inspect GA4/GTM and other marketing tags, duplicate IDs and live dataLayer activity.
Detect JWTs, API keys, cookies, cards and emails before exporting captured traffic.
The point is not to replace every network tool. The point is to shorten the distance between evidence and action.
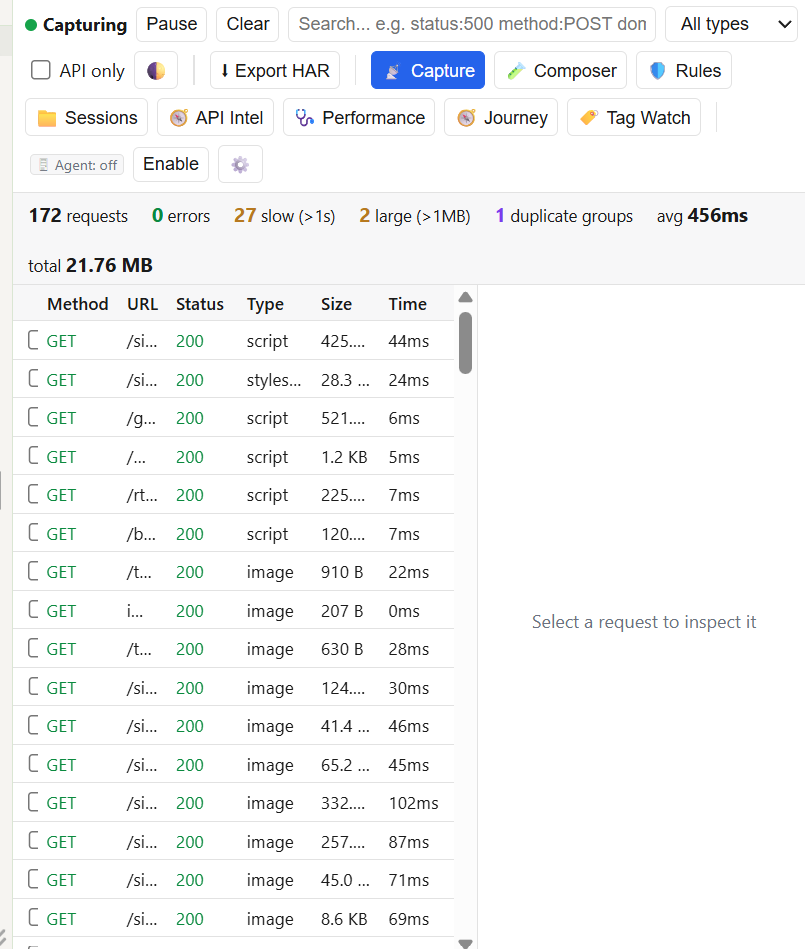
Capture first. Select the suspicious request. Then move directly into API Intel, Performance, Journey, Composer, Rules, Tag Watch or Privacy Scan.
Chrome is supported today. Microsoft Edge support is coming soon.
See installation guide →Open chrome://extensions and turn on Developer mode.
Choose Load unpacked and select the folder that contains manifest.json.
Open any page, press F12, then choose TraceAna from the DevTools tab bar.
Reload the page after opening DevTools. Requests will begin appearing in the capture view.
TraceAna documents platform boundaries instead of hiding them behind misleading UI.
Manifest V3 removed synchronous interception for normal extensions, so TraceAna does not pretend it can pause a request mid-flight.
Inspecting encrypted traffic requires a trusted MITM certificate. The optional bridge does not provide that decryption layer.
The supported MV3 path redirects to a data URL, so the mocked response cannot freely set a custom status or response headers.
Composer cannot freely set headers such as Cookie, Host or Origin because browser fetch rules restrict them.
TraceAna is built around local-first debugging and explicit user actions for export or optional local-agent communication.
Current AI-style analysis is rule-based logic inside the extension. It does not call an external AI API.
Captured sessions are stored in your browser profile unless you explicitly export or send them using a feature you choose.
The Privacy Scan can flag JWTs, API keys, cookies, card-like values and emails before export.
The bridge is off by default and communicates with a local agent you run yourself, including a phone or another app on your network.
For detailed troubleshooting and bug reporting, use the support center.
Inside Chrome DevTools. Open DevTools with F12, then choose the TraceAna tab. The extension is not primarily a toolbar popup.
No. The current analysis layer uses local, rule-based logic and does not make an external AI API call.
The optional Agent Bridge is designed for traffic outside the browser tab, including a phone on the same Wi-Fi. It does not decrypt HTTPS traffic.
No. Chrome Manifest V3 does not provide the synchronous interception needed for a normal extension to behave like a traditional breakpoint proxy.